
Reorder Point and Safety Stock: Formulas and How to Apply Them
Inventory management starts with two numbers: safety stock and the reorder point. This guide explains the formulas, walks through a worked example and covers the mistakes that leave warehouses both overstocked and out of stock.
For most small and mid-sized businesses, inventory management keeps coming back to the same question: when should we reorder, and how much? Answering it by gut feel usually produces two outcomes at once — fast movers run out while slow movers fill the warehouse. Two concepts bring discipline to that question: safety stock and the reorder point (ROP). This article covers the formulas, where to get the inputs, a worked example and how to feed the result into your purchasing process.
Why inventory management needs a reorder point
Every order involves a wait before goods arrive, known as the lead time. During that wait, stock keeps being sold or consumed. The reorder point is the stock level at which you must order immediately so that what remains covers demand until the new batch arrives.
If daily demand were always exactly the same and suppliers always delivered on time, the reorder point would simply be average daily demand × days of lead time. Reality is messier. Some weeks customers buy twice as much; some shipments arrive three days late because of port congestion. Safety stock is the buffer that absorbs both kinds of variability.
So the standard formula has two parts:
ROP = d × L + SS
where d is average daily demand, L is average lead time in days and SS is safety stock.
The safety stock formula based on service level
Safety stock should not be "add 20%" or "keep an extra week". A defensible approach is to choose a service level — the probability of not running out during one replenishment cycle — and calculate the matching buffer.
When both demand and lead time vary, and the two are independent, the commonly used formula is:
SS = z × √( L × σd² + d² × σL² )
| Symbol | Meaning | Source |
|---|---|---|
| z | Factor for the chosen service level | Standard normal table |
| d | Average daily demand | Stock issue history |
| σd | Standard deviation of daily demand | Stock issue history |
| L | Average lead time (days) | Purchase order date to receipt date |
| σL | Standard deviation of lead time | Actual receipts |
Common z values: a 90% service level corresponds to z ≈ 1.28; 95% to z ≈ 1.645; 98% to z ≈ 2.05; 99% to z ≈ 2.33. Note how quickly the cost rises at the top end: moving from 95% to 99% raises the buffer by roughly 40% while removing only four more percentage points of risk.
The formula has two terms under the square root, and many spreadsheets miss one of them. The L × σd² term reflects demand variability during the wait. The d² × σL² term reflects suppliers delivering early or late. For imported items or unreliable suppliers, the second term is often larger than the first.
Three common mistakes with the inputs
- Calculating the standard deviation only over days with issues. An item that ships 70 units on a single day each week has actual daily demand of 0, 0, 0, 0, 0, 0, 70. Drop the zero days and demand looks "very stable", producing a buffer close to zero. Zero days must stay in the sample.
- Using the lead time on the supplier record instead of the measured one. The figure on the record is usually typed once when the supplier is created and never updated. The actual time from order to receipt is the number to trust once you have enough receipts to measure it.
- Comparing the reorder point with shelf stock instead of inventory position. Inventory position is available stock + inbound stock (purchase orders placed but not yet received). Ignoring inbound stock leads to duplicate orders; ignoring stock reserved for sales orders leads to under-ordering.
Illustrative example: calculating a reorder point for one item
Illustrative example with assumed figures. A supplies distributor stocks safety gloves with the following 90-day data:
- Average demand: d = 20 pairs/day, standard deviation σd = 6 pairs/day.
- Lead time measured over the last 5 receipts: L = 10 days, σL = 2 days.
- Target service level: 95%, so z = 1.645.
Step 1 — safety stock. L × σd² = 10 × 36 = 360. d² × σL² = 400 × 4 = 1,600. The total under the root is 1,960, whose square root is about 44.27. SS = 1.645 × 44.27 ≈ 72.8, rounded up to 73 pairs.
Step 2 — reorder point. ROP = 20 × 10 + 73 = 273 pairs.
Step 3 — compare with ignoring lead-time variability. Counting demand variability alone gives SS = 1.645 × √360 ≈ 31.2, rounded to 32 pairs, and ROP = 232. The 41-pair gap is exactly the risk created by late deliveries. For this item, ignoring σL means stocking out far more often than the 5% you chose.
Step 4 — how much to order. Suppose the company reviews stock weekly (7 days). The order-up-to level equals the ROP plus one review cycle of demand: 273 + 20 × 7 = 413 pairs. Today there are 180 pairs available and 50 inbound, an inventory position of 230 — below the ROP. The proposed order is 413 − 230 = 183 pairs, then rounded to the supplier's minimum order quantity or carton size.
From formula to process: alerts, then purchase proposals
A formula only helps if it runs consistently. A practical process has four beats:
- Refresh inputs regularly. Recalculate d, σd and lead time weekly or monthly from actual issue and receipt history, not from estimates.
- Segment items. Not every item needs a 98% service level. Class A items (high value, steady sales) can justify a high level; class C items (low value, less critical) can accept a lower one to free up working capital.
- Alert when inventory position hits the reorder point. The alert should state which item, which warehouse, how much to order and why.
- Convert into a purchase proposal that a person approves. The alert does not place orders on its own. The buyer reviews it, adjusts for supplier promotions or seasonality, then creates the purchase order. From there, the order continues through receiving and invoice matching (see the procure-to-pay process and three-way match).
When the formula stops fitting
- Seasonal or campaign-driven items: past demand does not represent the near future; use a forecast adjusted for seasonality.
- Very slow movers (a few sales per quarter): the normal-distribution assumption breaks down; use a fixed minimum or order to demand.
- Materials for planned production: calculate requirements from the production plan (MRP) rather than from issue history.
How XBuddy supports this
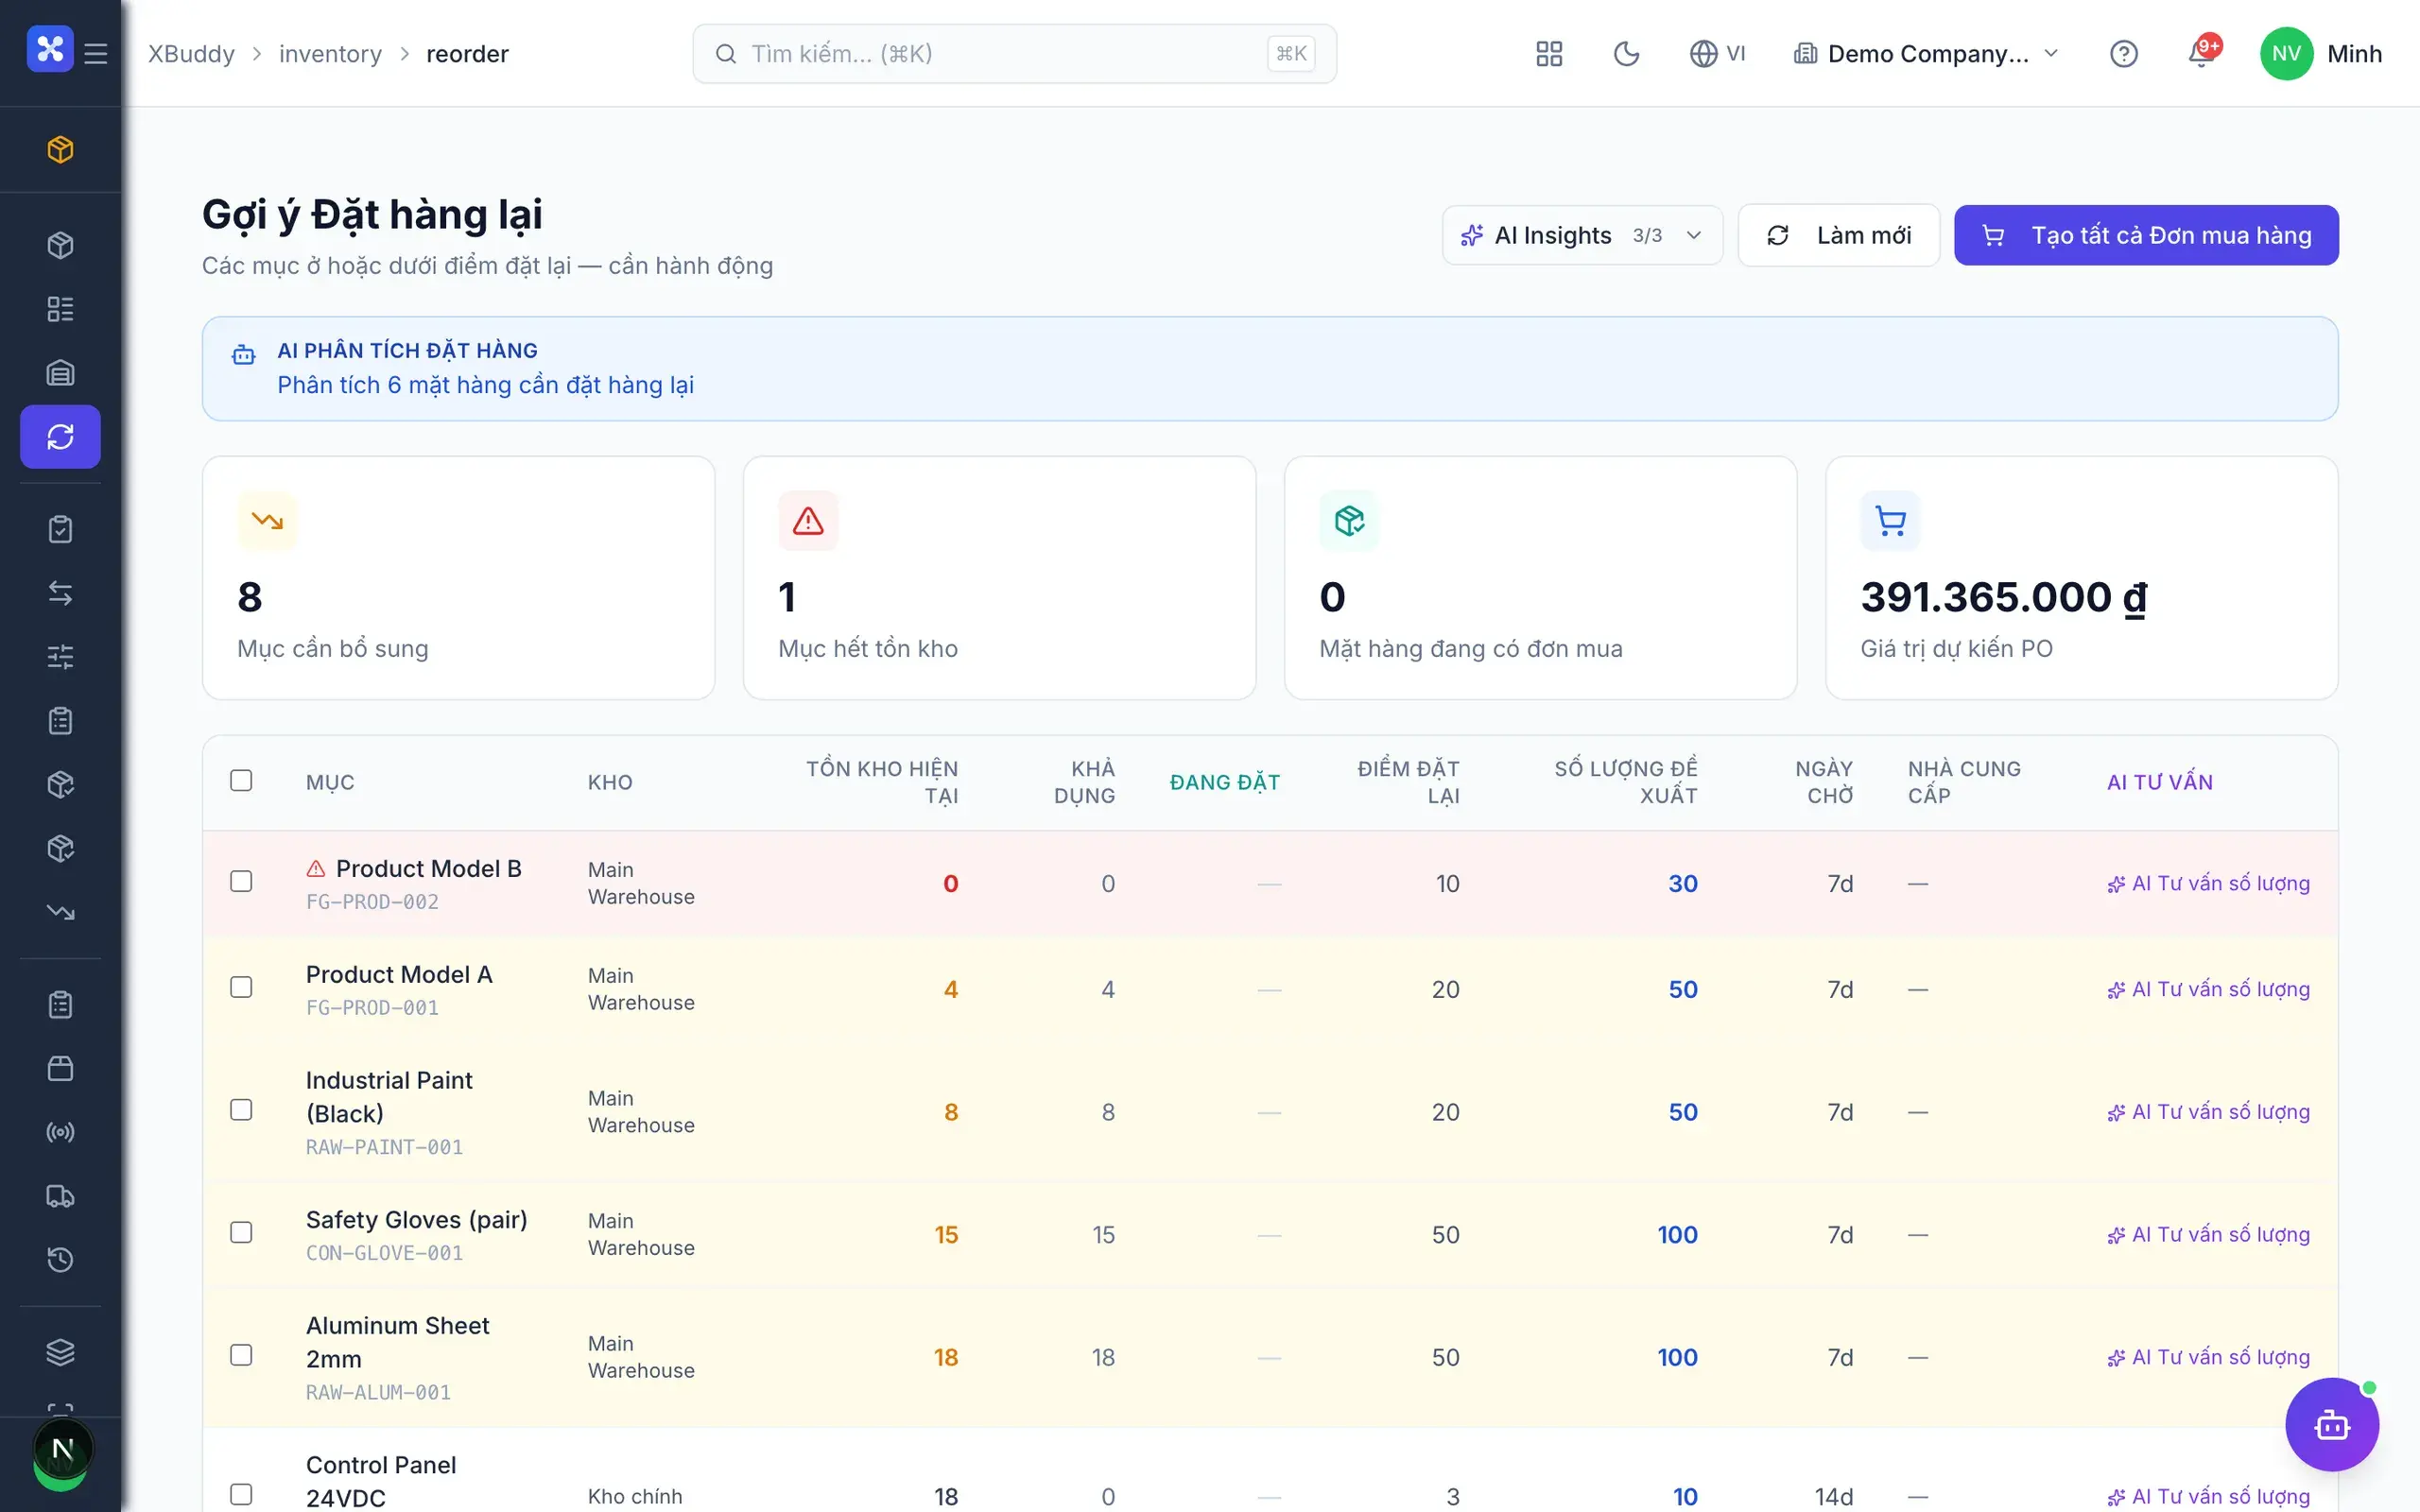
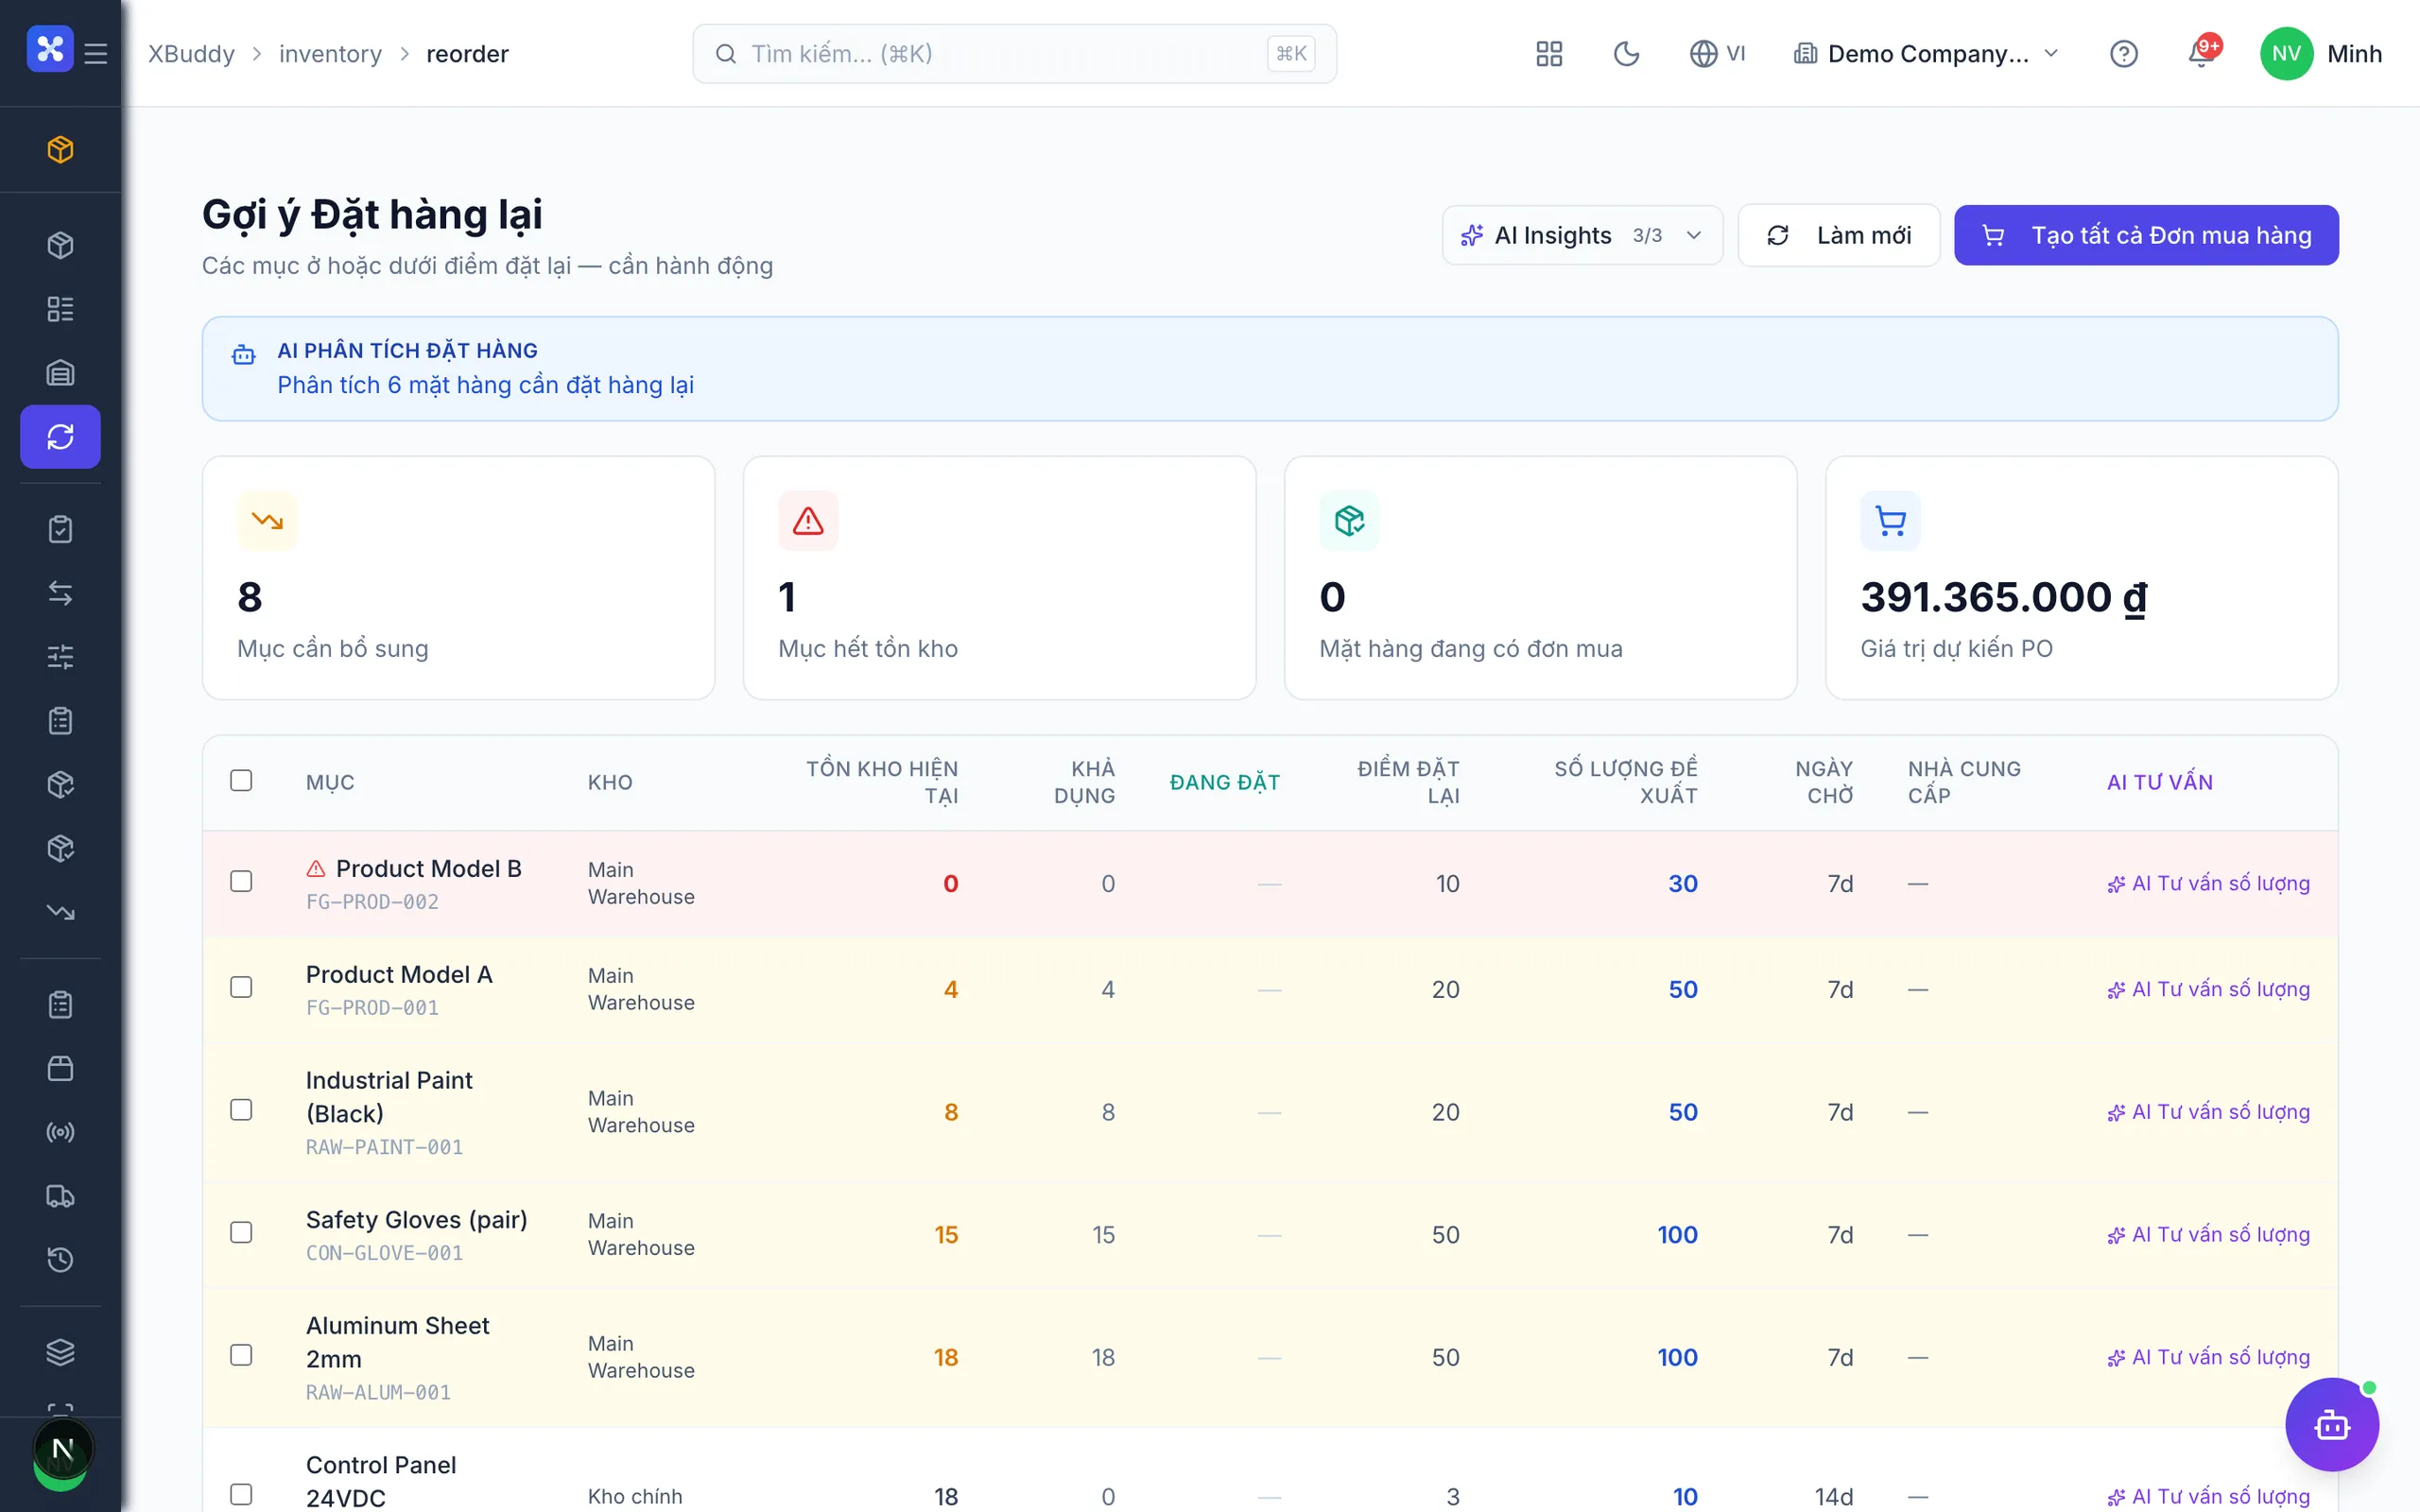
In XBuddy's Inventory app, the Reorder Suggestions page lists items at or below their reorder point per warehouse, with on-hand stock, available stock, quantity on order, suggested quantity and lead days. Buyers can select the lines they need and create purchase orders from the suggestions; the reorder point alert is a toggle that is on by default.
The Inventory Planner AI assistant uses the same model described above: service-level safety stock that includes lead-time variability, with demand deviation calculated over every day in the window, including days with no issues. Lead time prefers the figure measured from actual receipts once there are at least three receipts in the past year; otherwise it falls back to the value configured on the item or supplier, and the result states which source it used. The assistant only proposes; a person approves before any document is created. For multi-warehouse operations, see the Warehouse solution.
Frequently asked questions
What is the difference between safety stock and the reorder point?
Safety stock is the buffer against variability in demand and lead time. The reorder point is the stock level at which you must reorder, equal to expected demand during the lead time plus safety stock. In other words, safety stock is one component of the reorder point.
What service level should we choose?
There is no single number for every item. Critical, high-margin items, or items where stockouts lose customers, typically use 95–98%. Low-value, easily substituted items can use 90% to reduce tied-up capital. Start with an ABC classification and assign service levels by class.
How much history do we need?
For steadily selling items, 90 days of issue history is usually enough to estimate average demand and its standard deviation. Lead time needs at least several actual receipts from the same supplier; until then, use the supplier's committed lead time and label it as an assumption to replace once you have measurements.
Should orders be placed automatically when stock hits the reorder point?
Usually not entirely. Proposals should be reviewed by the buyer because there is information the formula does not know: supplier promotions, a large deal about to close, or an item being discontinued. Automate the calculation and the alert, and keep a person at the decision step.
How often should reorder points be recalculated?
For most businesses, weekly or monthly is reasonable. Items whose demand changes quickly, or that have just changed supplier, deserve an earlier review. What matters is that recalculation runs regularly from real data rather than being adjusted by hand after a stockout.