What usually goes wrong without it
To see the whole picture, accounting and the CEO's assistant export Excel from each system and merge it. Every merge drifts the numbers and takes days.
Each new question from management needs a new report, and each new report waits for someone who can query the data.
Emailing report files means no control over who sees payroll or P&L. Granting broad access for convenience means everyone sees everything.
7 steps, one chain of documents
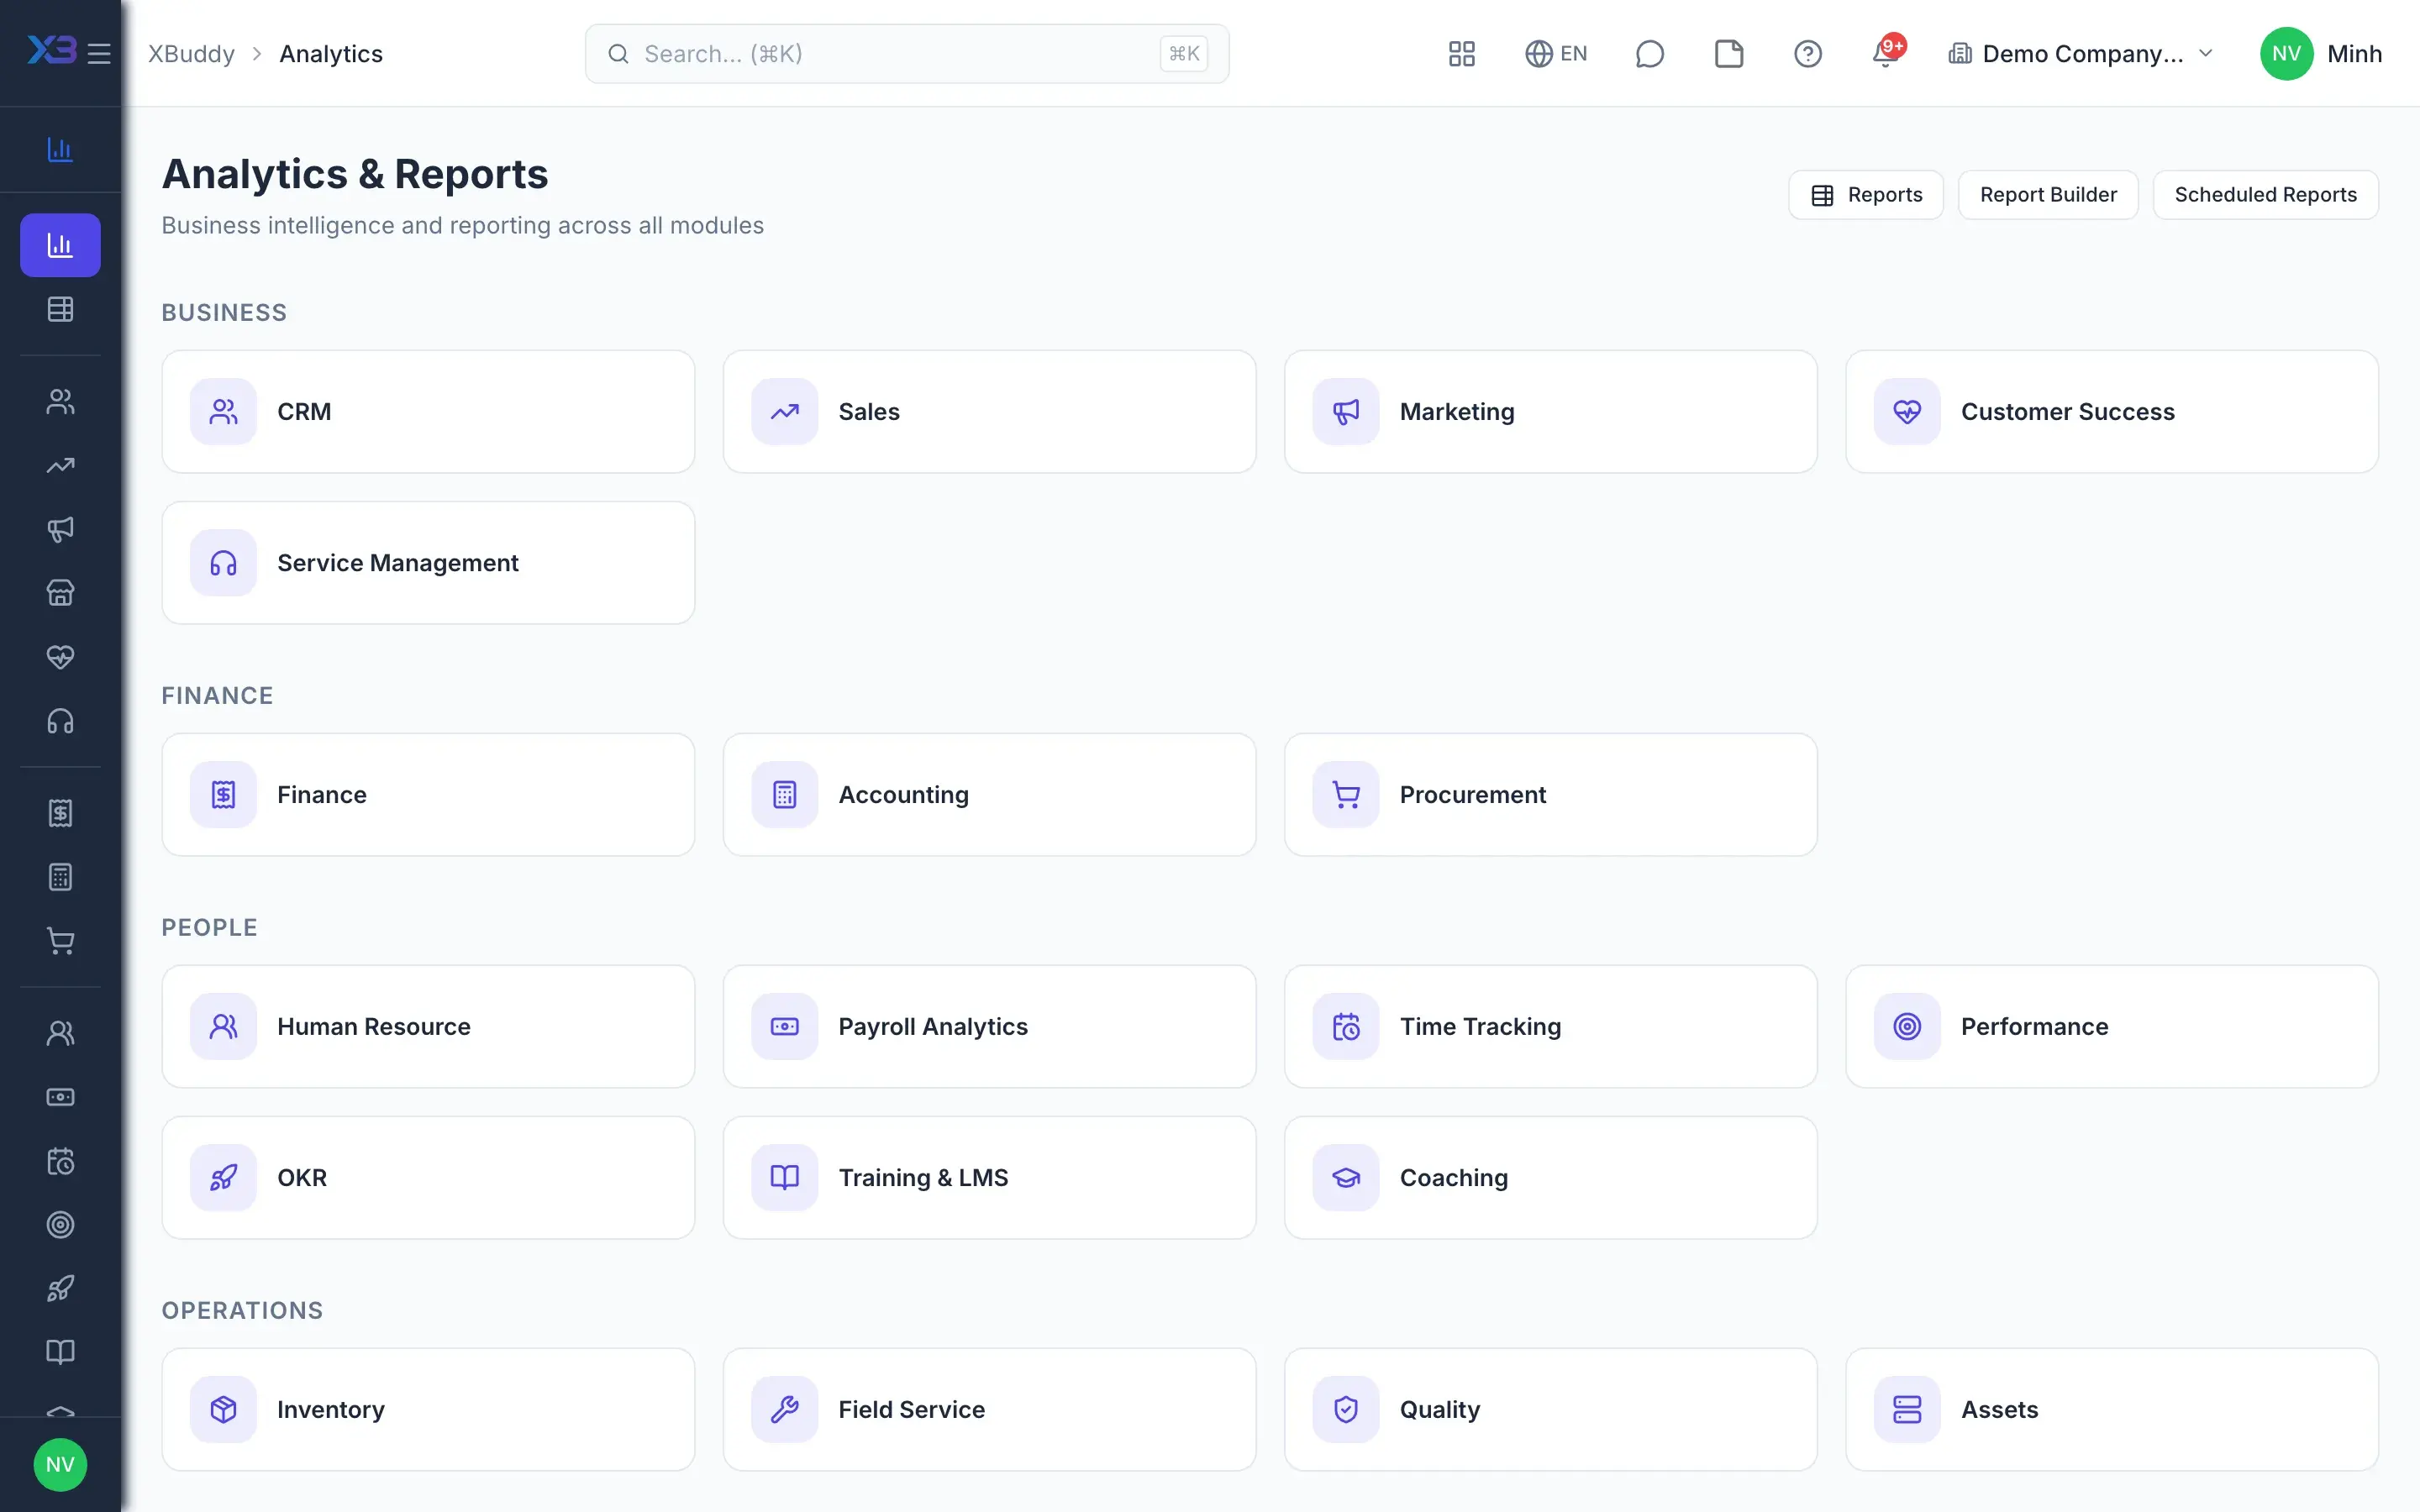
- 1Company-wide overviewManagement opens the Analytics overview for a quick read on the business. Each domain appears only when the company has that app and the viewer has permission, so there are no empty tiles or numbers for unused areas.
- One entry point for every domain
- Only domains the company uses appear
- Included with existing apps, no extra purchase
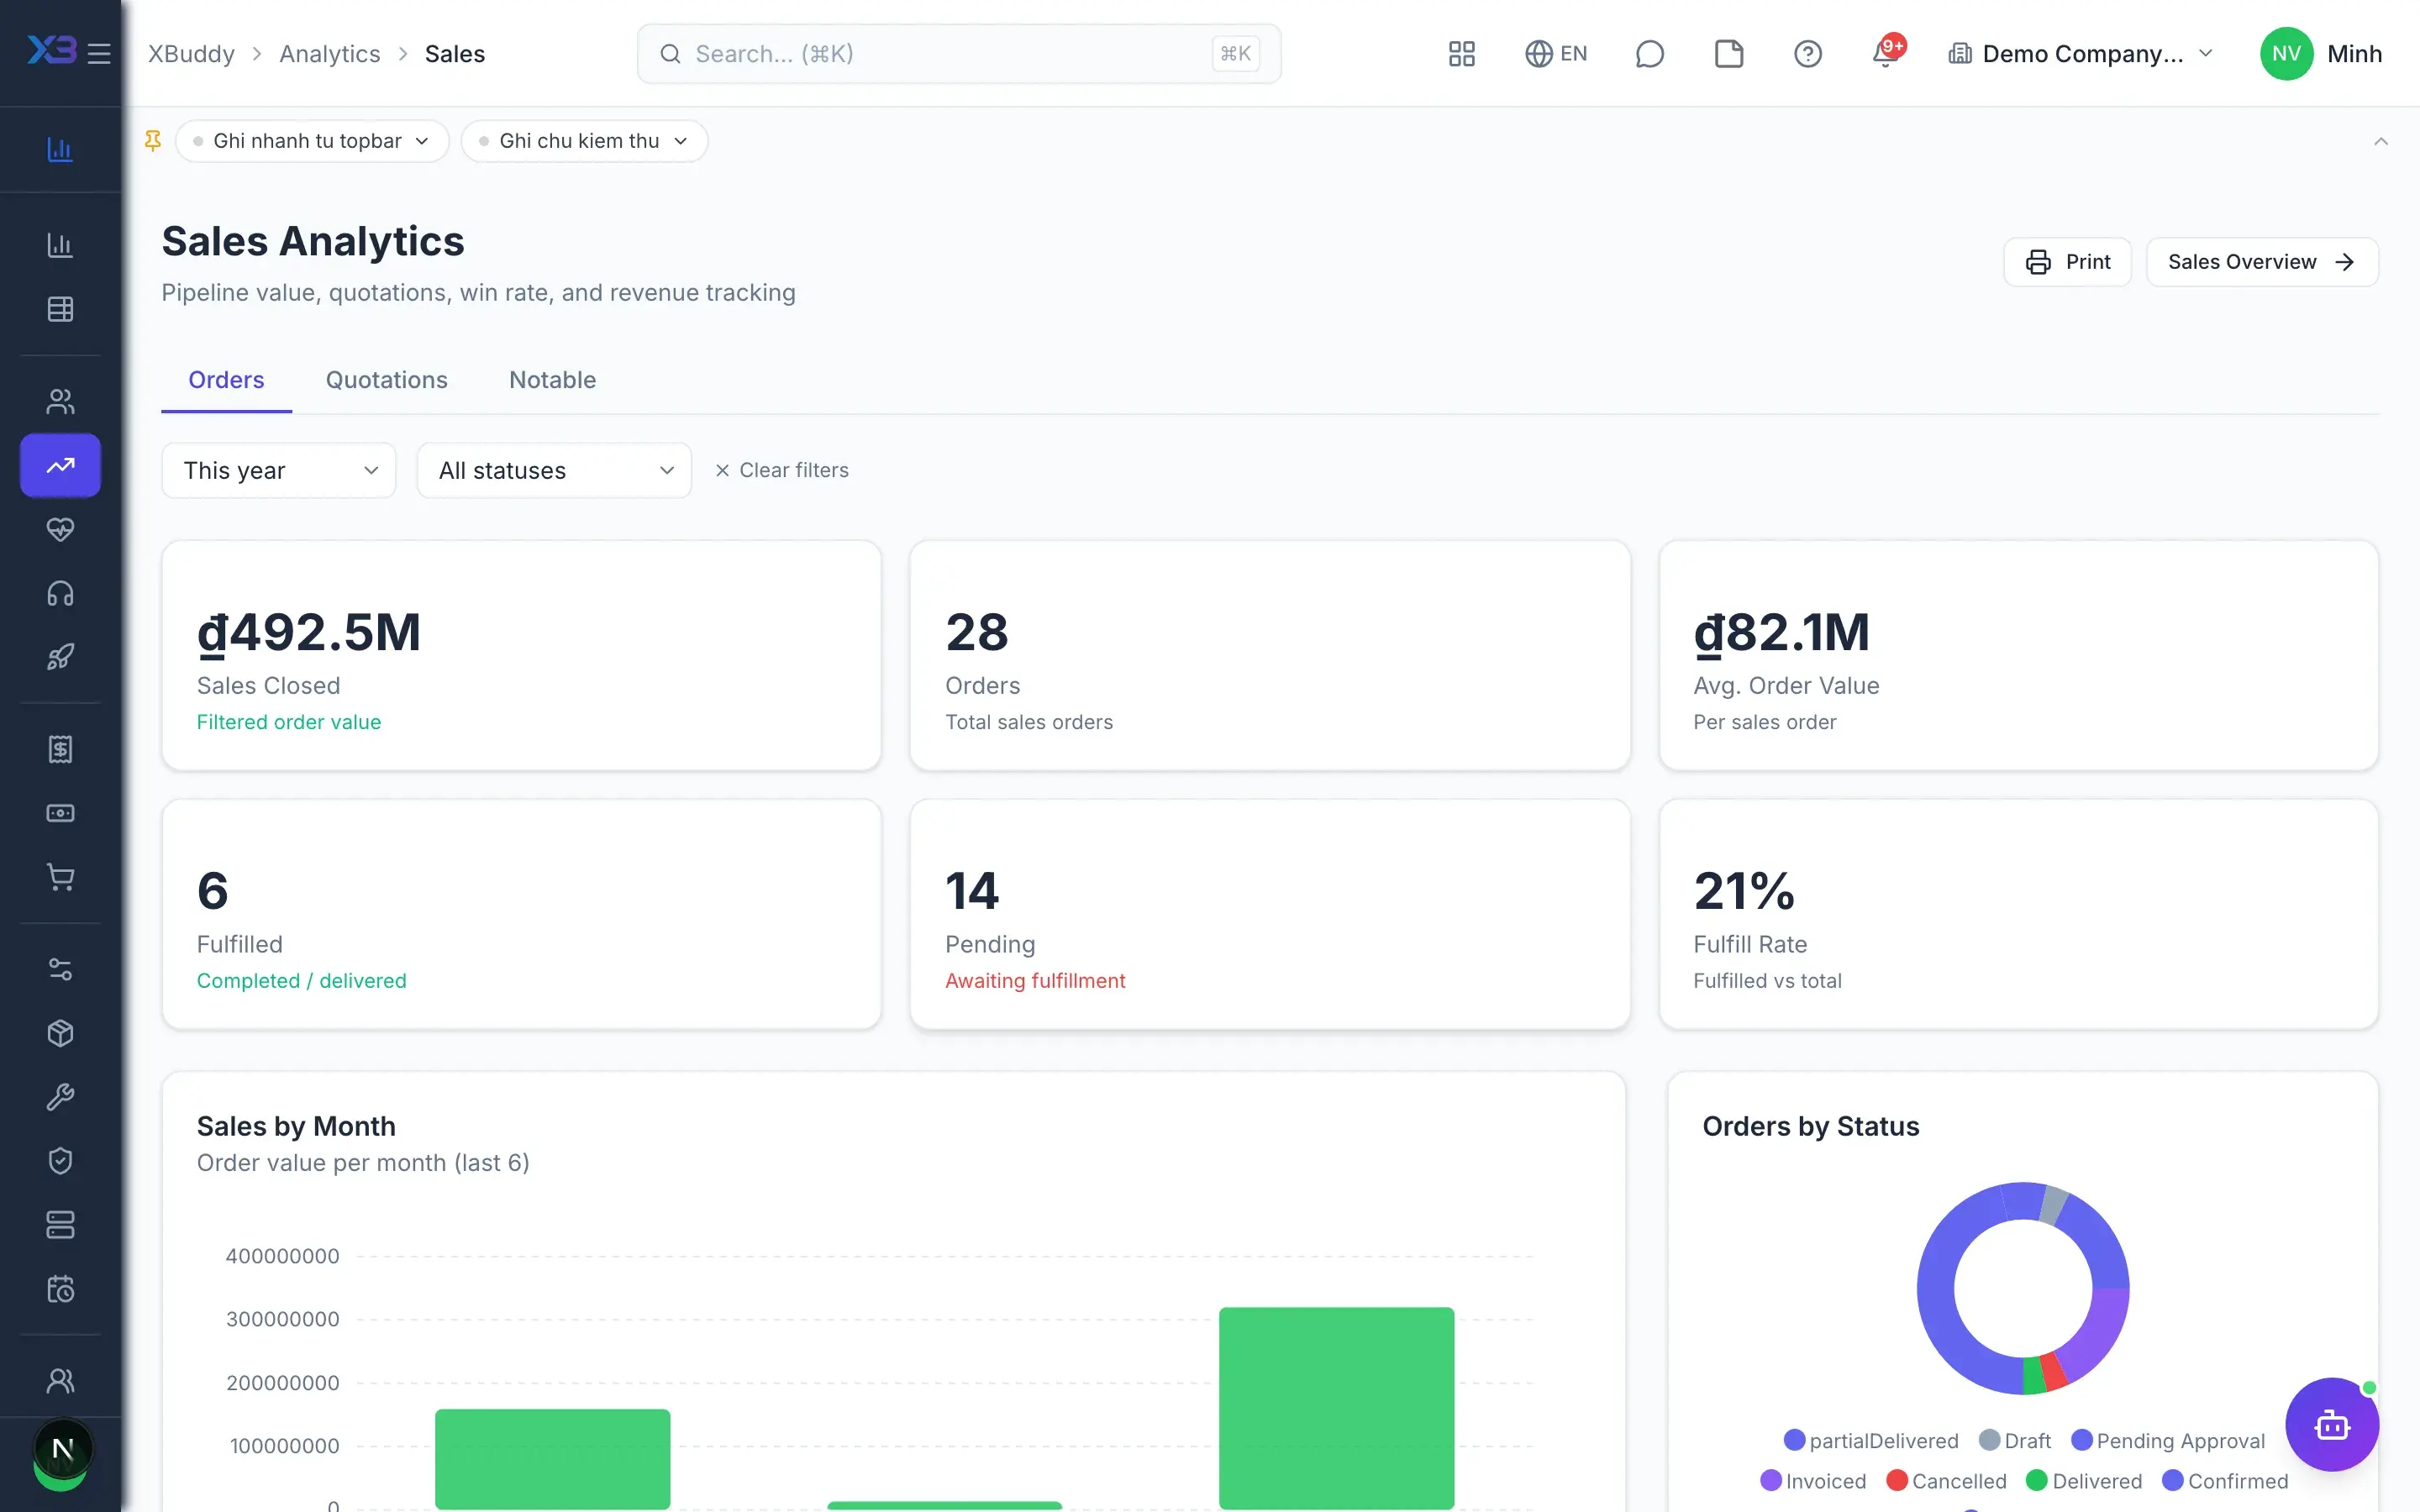
- 2Drill into each domainEach domain, such as sales, CRM, finance, inventory, manufacturing, projects or HR, has an Overview tab rendering the source app's own Overview page, so managers read the same numbers the department uses. The Reports tab lists that domain's business reports.
- About 30 domains in one frame
- Overview tab is the app's own Overview page
- Reports tab per domain
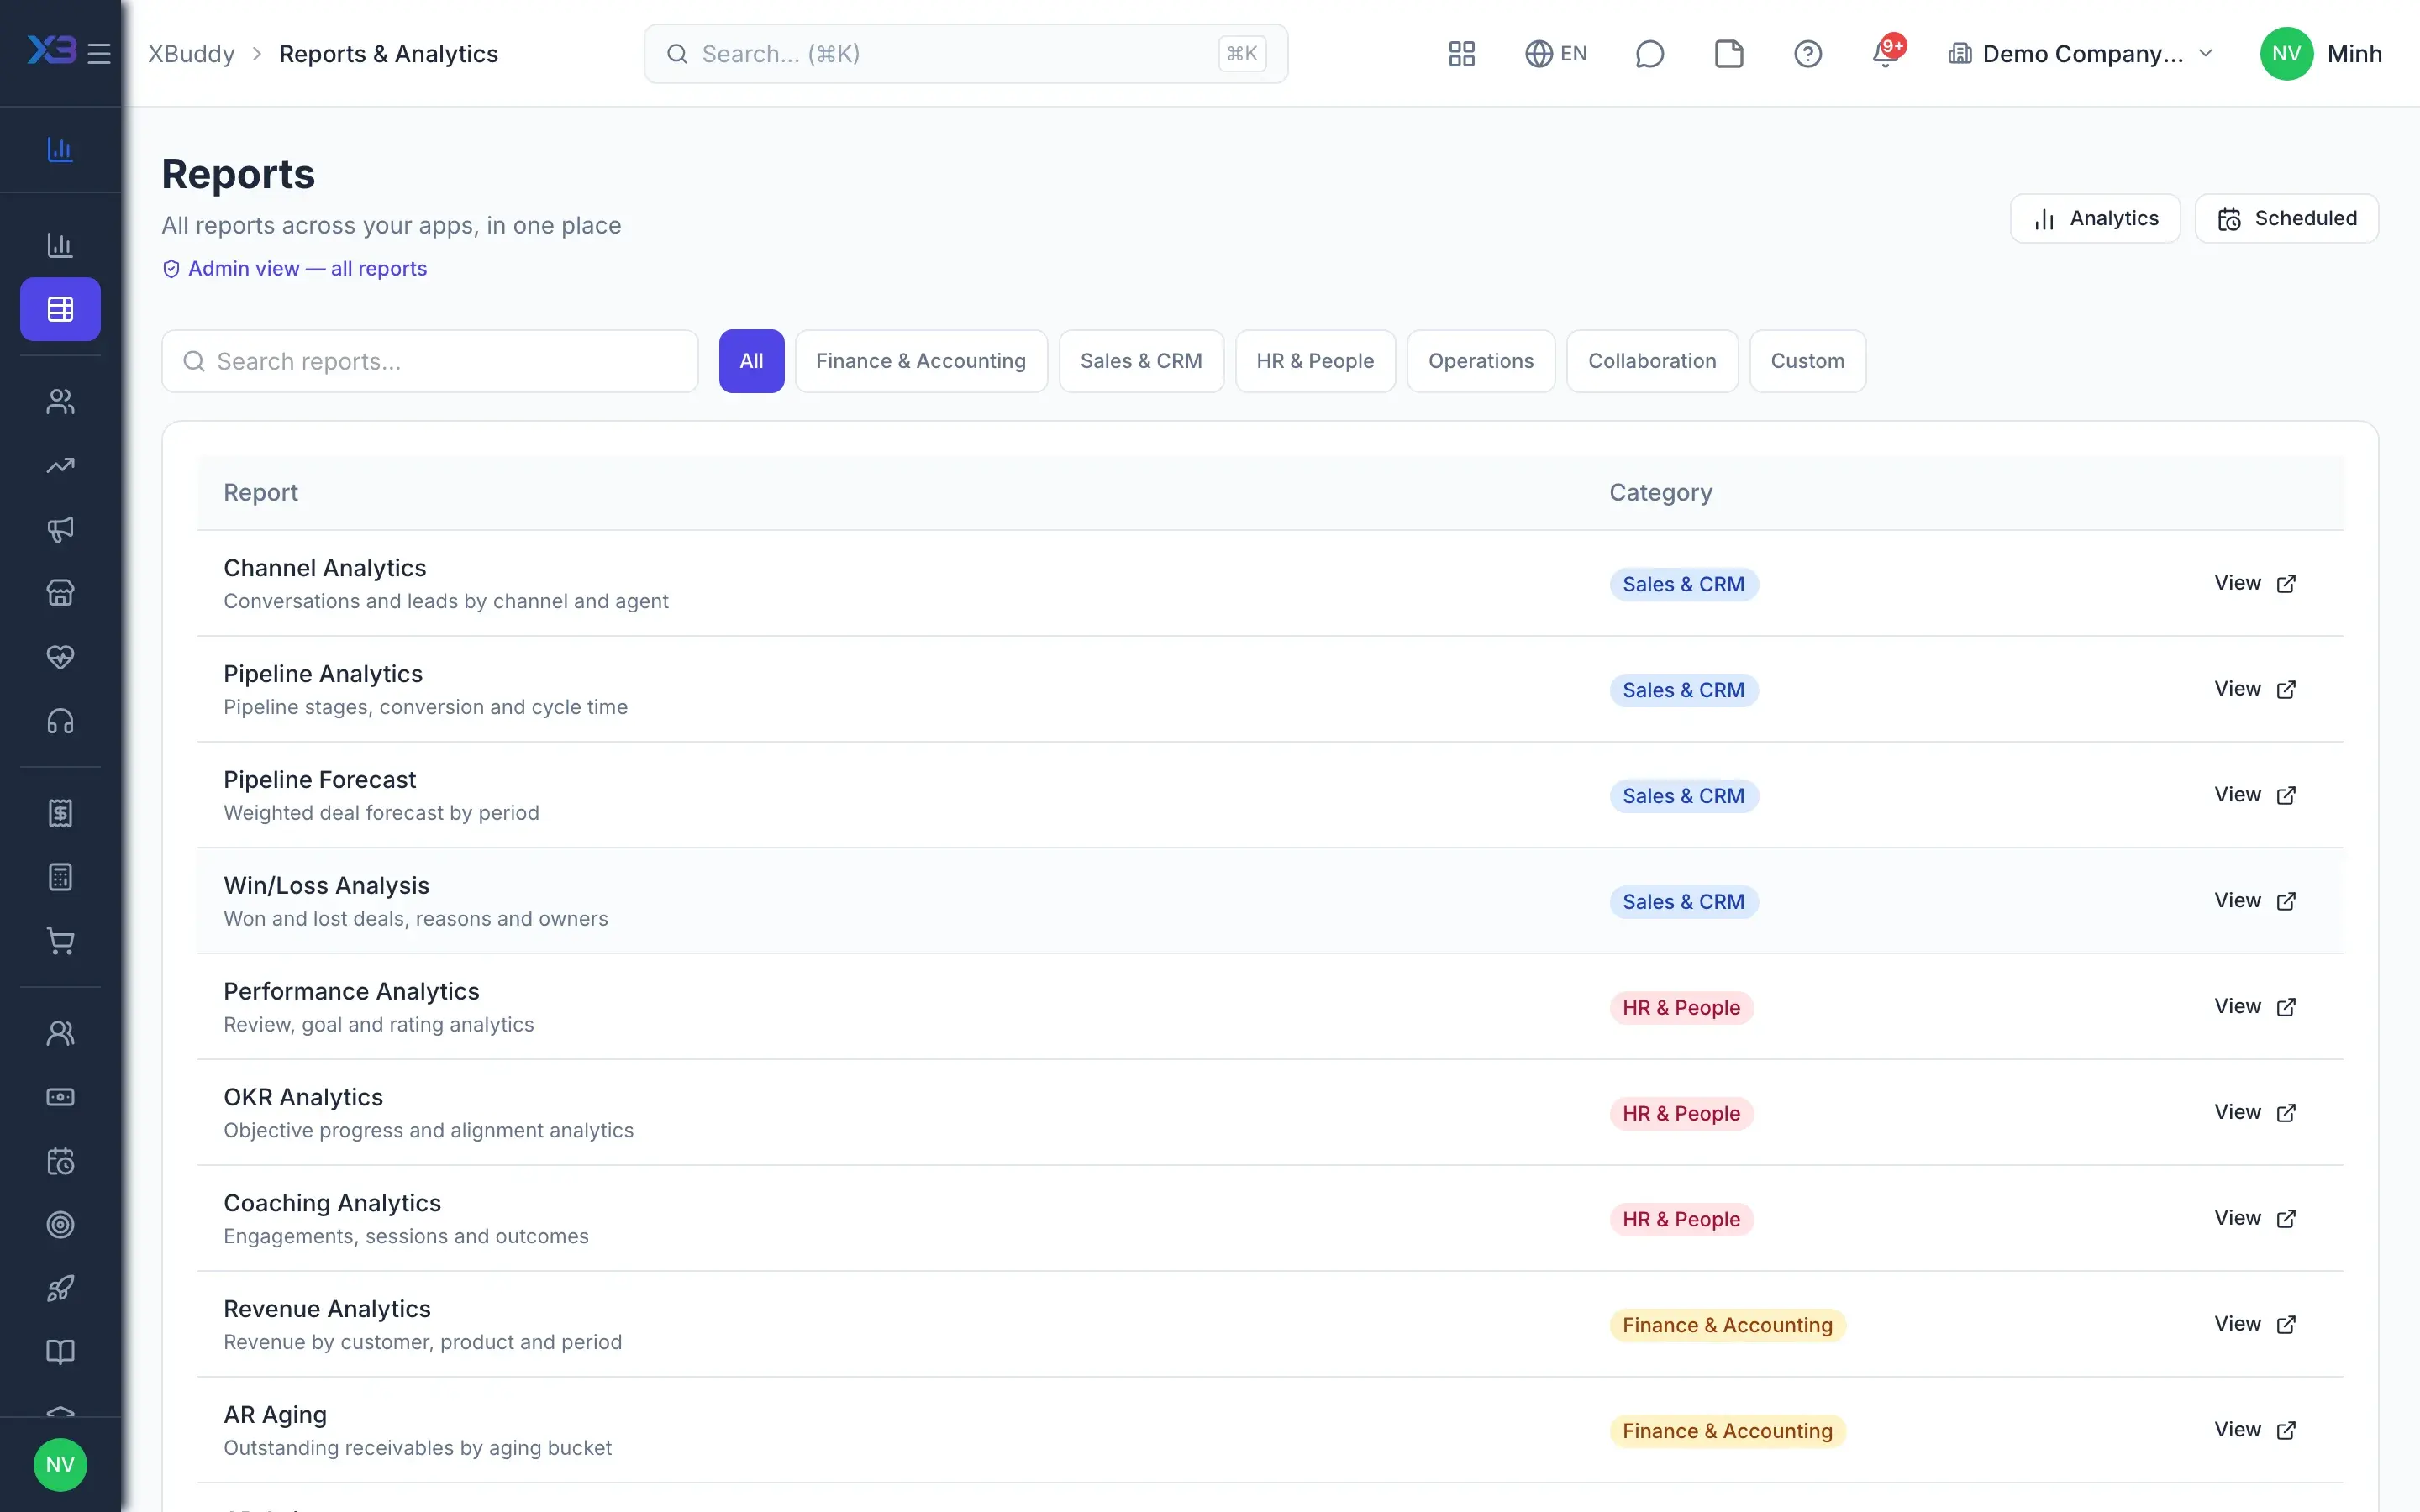
- 3Business report libraryThe report library brings together ready-made reports for finance, sales, CRM, HR, projects, services and time tracking. Reports open inside Analytics but still pass through the source app's permission gates, with shared filters and CSV export.
- Ready-made reports from many departments
- Open in place, source app permissions still apply
- Shared filters and CSV export
- 4Build your own reportFor a specific question, users open Report Builder, pick a data source such as customers, deals, invoices, sales orders, purchase orders, journal entries, employees, inventory, projects or tasks, then choose columns, filters and grouping. Unsupported sources return a clear error, never a fake empty table.
- Pick source, columns, filters, grouping
- Drag dimensions and measures onto the canvas
- Unsupported sources error, no empty tables
- 5Save and scheduleBuilt reports are saved to reopen later. Schedules deliver reports as CSV by email daily, weekly or monthly; recipients must be company members and the system checks the schedule creator's access to the data source.
- Save and reopen reports
- CSV delivery daily, weekly, monthly
- Recipients must be company members
- 6Control who sees whatAdmins grant report access by role or by user. With per-domain enforcement on, querying a source requires that domain's analytics permission, such as payroll analytics, both when viewing and when emailing.
- Report access by role or user
- Per-domain analytics permissions
- Enforced on query and on email delivery
- 7AI interpretationThe executive briefing assistant compiles a daily summary and explains strategic KPIs in plain language, with reports on data freshness and KPI regressions. For follow-up questions, managers ask XBuddy Chat, which answers from data within their permissions.
- Daily executive summary
- KPI narration and regression detection
- Ask XBuddy Chat within your permissions
Every step is a familiar screen
6 real scenarios with how-tos
2 apps in this solution
Assistants that work the process with you
Executive Briefing
Compiles daily and weekly briefings with strategic KPI narratives and data-freshness checks for leadership.
FP&A Analyst
Forecasts cash flow, analyzes revenue trends, and monitors budget variance and cross-domain anomalies.
Detailed paper: Management analytics & reporting
End-to-end process, apps involved, AI assistant roles, KPIs and a 30/60/90-day rollout plan.
Is Analytics an extra purchase?
No. Analytics is included for the apps a company already has; each domain page appears only when that app is in use.
Do analytics numbers match the department's?
Yes. Each domain's Overview tab renders the source app's own Overview page, reading the same data the department uses.
Can reports be sent outside the company?
No. Recipients must be company members, and the system checks the schedule creator's access to the data source before sending.
What format are scheduled reports?
CSV by email, daily, weekly or monthly.
Is there a separate data warehouse or OLAP?
Not yet. Analytics reads the apps' transactional data directly; the advanced analytics add-on is listed as coming soon and cannot be purchased.
Does AI change report numbers?
No. The executive briefing assistant only produces summaries and observations; it does not change data.